
On the Key Performance Indicators page, you define which business metrics you want to monitor. You select which values are included in the calculation and how the result is displayed. You can then include the KPI in the Weekly Overview to compare the days and track development over time.
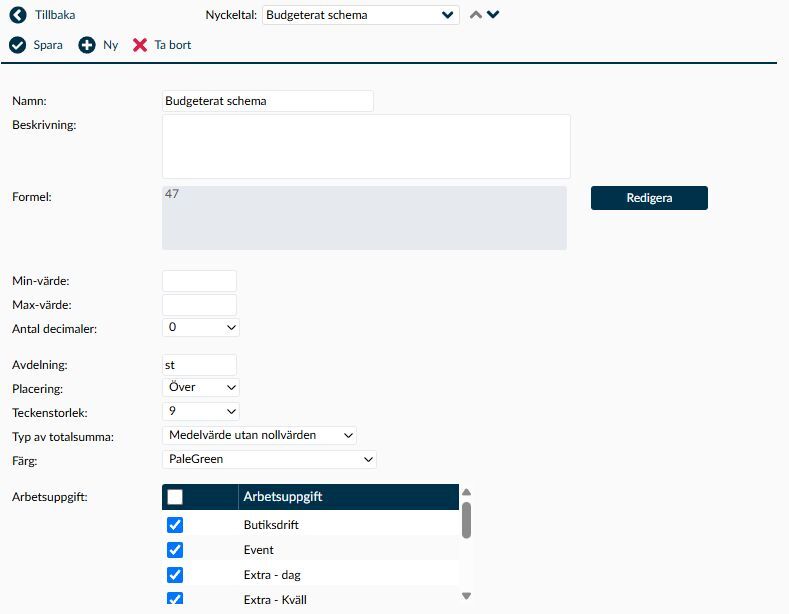
Image 1. The detail view shows how the KPI is calculated and presented. The Department field above Placement refers to the unit for the result. The selection of tasks is found further down and serves a different purpose.
A KPI helps you relate tasks to each other. For example, if you want to track sales per worked hour, the calculation needs both the sales and the actual time worked. A result based on planned hours answers a different question.
The KPI retrieves its values from accounts and system values available in the formula editor. It does not register sales, working hours or other basic data for you. The values must therefore exist on the correct account, date and level before the result can be interpreted.
This page is where you create the definition yourself. In the Weekly Overview, each administrator then selects which KPIs to display. Saving a new KPI does not automatically make it visible in everyone’s planning.
The system value [TASK_TIME] is the planned time after break for staffed shifts, not actual worked time. A zero result is also not always a true business result: missing account values and certain calculation errors, such as division by zero, can result in zero shown in the display. Verify the underlying data before using the result for follow-up or decision-making.
- Give the KPI a name that clearly indicates what you are comparing, for example Sales per worked hour. Use different names for metrics based on planned versus worked time to avoid confusion.
- In Description, explain which data the result is based on and how it should be interpreted. Indicate if absence, breaks or specific tasks affect the measure. The description is especially valuable to those using the KPI without having created the formula themselves.
- Check the existing list before choosing a name. Do not rely solely on the save function warning you about a name already in use.
The Formula field shows the calculation with readable account names. Select Edit to work with it in the Edit formula dialog.
- Account selection fetches values from accounts managed on the Accounts page. Check both the account’s unit and its balance level, i.e., whether values relate to an employee, task or company. An account for a quantity, an amount, and a time cannot be interchanged simply because the names appear similar.
- Time from time accounts is used in hours, amounts are in whole currency units, and quantities retain their unit. Do not include additional conversions from minutes or cents if the account value is already recalculated.
- If the day’s account value is missing, the calculation can use zero. A saved KPI thus does not confirm that import, registration or calculation has filled all days with correct data.
- An account that can no longer be referenced may appear as [Error!] in the formula. Investigate which account the expression referred to before choosing another. An account with a similar name does not necessarily include the same data.
System values are predefined methods for retrieving certain planning data. They do not replace all types of accounts.
- `[TASK_TIME]` retrieves the planned time after break for shifts with an assigned employee within the KPI’s selected tasks. Unstaffed shifts are not included. All shift types are included in this system value, so it may not match the total shown in another planning view.
- `[DEVIATION_TIME]` retrieves planned time after break for employees and days that have a deviation code. It is not a general summary of hours on an absence account. Select that specific account if you want to track such a balance.
- `[DAY_TASK_COUNT]` counts, within the current calculation, distinct employees with applicable shifts. Two shifts for the same employee count as one, and unstaffed shifts are excluded. Do not use this value as the number of tasks or a reliable count of shifts worked.
- `[CURRENT_DATE]` refers to the calculated date, not the date when you open settings. There is a known limitation for January dates where the year may be incorrect. Have the Timeplan administrator verify any date-dependent formula before use in follow-up.
- `-d` is used before an account expression to retrieve the immediately preceding calendar day. The function does not work the same way for all system values listed above. Do not assume that adding
-dalways shifts the entire calculation one day backward.
- Min value and Max value define the range you consider normal. Values below the lower or above the upper limit are marked. A value exactly equal to a limit is still considered within range.
- Limits apply both to individual days and the period’s total. Ensure that the same limits make sense for both, especially if the period shows a sum.
- The comparison to limits is done before rounding for display. A highlighted value may therefore appear equal to the limit when few decimals are shown.
- Number of decimals determines how precisely the result is displayed, from zero to four decimal places. Check this choice even for a new KPI; do not assume it is preset to two. The display setting does not affect the underlying calculation.
- The field labelled Department above Placement here refers to the unit that appears after the result, for example kr/h or %. It does not select a department. The label is misleading, so distinguish it from the task selection below.
- The unit is added as text after the value. If you enter %, the formula must still calculate the correct percentage; the text does not convert the result.
- Placement with options Above and Below determines whether the KPI row displays above or below the planning area in the Weekly Overview.
- Font size and Colour help differentiate the measures. They do not affect which values are fetched or how the result is calculated.
Choose the total sum type based on what the period value should communicate. Daily results may be valid even if an unsuitable summation method makes the period value misleading.
- Summation adds together the daily values that can be calculated. This is suitable when daily results are actual values you want to sum.
- Average divides the sum by the number of dates in the displayed period. Days with zero or no calculable value are included in the count, which can lower the average.
- Average excluding zeros uses only calculable days that are not zero. If no such days exist, a dash is shown.
If three days have results 10, 0 and 20, then Summation is 30, Average is 10, and Average excluding zeros is 15. For a measure like sales per worked hour, however, the average of daily ratios is not automatically the same as the entire period’s sales divided by all hours worked.
- Mark the tasks whose underlying data should be included in the KPI. Check this separately from which tasks you are currently viewing in the Weekly Overview.
- The account’s balance level is also important. Some budget and planning accounts may include company-wide values without a specific task and can be included even if the KPI has a more limited task selection.
- If a result seems too large, check both tasks and account level before changing the formula. A company-wide value should not be interpreted as applying only to the selected part of the business without consideration.
This section explains how to build the formula and what the different save steps mean.
Start by defining the question the KPI should answer. For a metric like cleaned rooms per worked hour, you need an account for the number of cleaned rooms and an account for actual worked hours. Selecting planned time instead results in a different measure.
- Select New and enter name and description.
- Open the formula with Edit and choose accounts or system values matching the question.
- Set display and total sum type and select tasks.
- Select the page’s Save when the entire definition is ready.
- Retrieve the KPI in the Weekly Overview and compare a day with known data.
The result should be explainable based on the selected data. Saving the formula does not itself prove it measures what you intended.
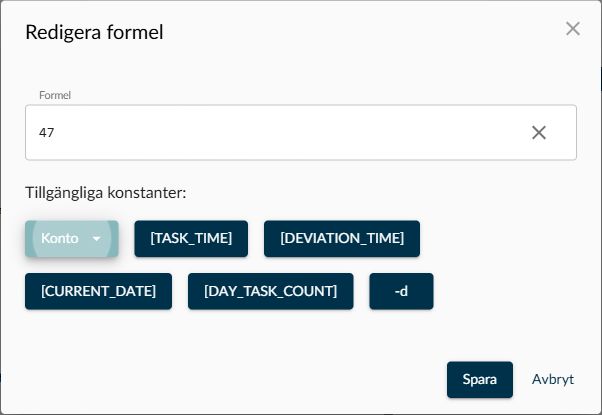
Image 2. In the Edit formula dialog, you write the expression and select from available constants. The dialog’s Save and the page’s Save are two different steps.
In the dialog, you write and change the expression. Under Available constants are accounts and system values you can insert where you are working.
- Place the cursor where the next value should be inserted. If text is selected, the choice replaces the selected portion.
- Choose an account under Account, or select the system value you need. Use operators and parentheses to clarify the calculation order.
- Especially check what value you divide by. If the account lacks a value, the calculation may divide by zero, even if the same formula works another day.
- Choose the dialog’s Save to return the formula to the page, or Cancel to exit the dialog without applying changes.
- Verify the rest of the KPI and then select the page’s Save.
- The clear symbol X empties the formula in the dialog. Use Cancel if the clearing was accidental and you want to exit without applying it.
- The dialog’s Save does not save the entire KPI. That step is only complete when you also use the page’s save function.
- If you receive Invalid formula! Correct the formula and try again., check parentheses, accounts and operators. An unusually long formula may also hit a different limit on the page save than in the editor. Contact the Timeplan administrator if the expression is accepted in the dialog but cannot be saved on the page.
- Review both the formula and the tasks before saving. A change can affect results for other administrators who have already selected the KPI in their Weekly Overview.
- If an error appears, check what actually remains on the page and in the list before trying again. Do not assume that all parts of a new definition are always restored after an error.
- Saving does not create missing account values nor confirm that underlying calculations are complete. Follow up an unexpected result from the account’s data, not just by resaving the KPI.
When a KPI is deleted, its definition, task connections and users’ selections in Weekly Overview are removed. The accounts, account values and shifts the calculation built on remain.
- Check if others use the measure before selecting Delete.
- Read the confirmation and cancel if you opened the wrong KPI. Confirm only when the entire definition should be deleted, not if you just want to stop showing it in your own view.
- If you only want to hide the KPI for yourself, instead change your selections in Weekly Overview.
- On the Accounts page, what the account measures, its unit and balance level are determined. Registrations, calculations and imports can then provide the values the KPI uses.
- Manual balances are used for some data recorded manually. A KPI does not replace that registration.
- In the Weekly Overview, you activate Show KPI under Settings and choose which saved measures you want to track. The KPI’s own definition controls the calculation; your display choices control what you see.
Check that Show KPI is enabled and that you have selected the KPI in your settings. Then check the definition’s tasks and that the data covers the period you are viewing. A saved KPI is not automatically activated for all administrators.
Start by checking the accounts’ dates, units and balance levels. Missing account values can be counted as zero, and certain invalid divisions may also show as zero. A dash indicates that no value is available to display; for Average excluding zeros, this occurs when no calculable day differs from zero. Therefore, do not interpret zero and dash as the same.
Check if the formula uses `[TASK_TIME]`. This is planned time after break for staffed shifts, not registered or calculated working time from time reports. If you want to measure actual worked time, the formula must use the account containing that time.
Check the Type of total sum and how many dates the period includes. Ordinary Average includes all dates in the denominator, whereas Average excluding zeros excludes zero values and uncalculable days. For a ratio, you also need to distinguish between the average of daily ratios and a calculation based on the period’s aggregated data.